Supplements
This is a Quarto website that I created for ‘A Practical Guide . . .’

Code and Supplements for “A Practical Guide to Data Analysis Using R”
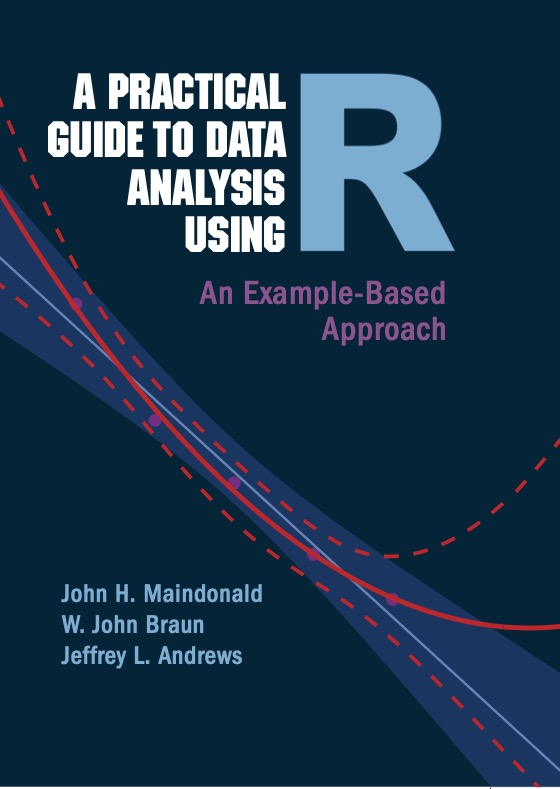
Here is made available code and other supplementary content that relates to the new Cambridge University Press text:
“A Practical Guide to Data Analysis Using R – An Example-Based Approach”,
by John H Maindonald, W John Braun, and Jeffrey L Andrews.1
The new text builds on “Data Analysis and Graphics Using R” (Maindonald and Braun, CUP, 3rd edn, 2010.)
Links to further items that may be of interest
Updated version of early 2000s booklet on R
https://jhmaindonald.github.io/usingR-Booklet
This is now to a large extent superseded by tutorials that are available on the web. Beginning R users may nonetheless find it useful as an introductory document for learning about R.
What does the data say? – Traps to Avoid
Examples that inform and educate
Examples, from the media and from the published literature, are used to illustrate some of the ready traps to which those who analyze data can readily fall. The booklet is in the style of what Kahneman (2013), in his book Thinking Fast and Slow, calls “educating gossip”. Its examples may be used to supplement, or in a few cases offer a further perspective on, those in A Practical Guide to R. The source files are all available from
Answers to selected exercises
Corrections
The following is designed to replace Exercise 3 in Chapter 8 from the published text, where the second sentence refers to a non-existent Chapter 3 model fit;
8.3. Use
qqnorm()to check differences from normality innsw74psid1::re78. What do you notice? Use tree-based regression to predictre78, and check differences from normality in the distribution of residuals.
What do you notice about the tails of the distribution?
Use the function
car::powerTransform()withfamily='bcnPower'to search for a transformation that will bring the distribution ofre78closer to normality. Run summary on the output to get values (suitably rounded values are usually preferred) oflambdaandgammathat you can then supply as arguments tocar::bcnPower()to obtain transformed valuestran78ofre78. Useqqnorm()with the transformed data to compare its distribution with a normal distribution. The distribution should now be much closer to normal, making the choice of splits that maximize the between-groups sum-of-squares sums of squares about the mean a more optimal procedure.Use tree-based regression to predict
tran78, and check differences from normality in the distribution of residuals. What do you now notice about the tails of the distribution? What are the variable importance ranks i) if the tree is chosen that gives the minimum cross-validated error; ii) if the tree is chosen following the one standard error criterion? In each case, calculate the cross-validated relative error.Do a random forest fit to the transformed data, and compare the bootstrap error with then cross-validated error from the
rpartfits.
Footnotes
The new text builds on “Data Analysis and Graphics Using R” (Maindonald and Braun, CUP, 3rd edn, 2010.)↩︎